Purpose
The DIR CT Facility Comparisons Report provides insight into Corporate Account and Facility performance as compared to the registry as a whole for the dose indices' measures: CTDIvol, Dose Length Product (DLP), and Size-Specific Dose Estimate (SSDE). The report highlights dose outliers for a variety of characteristics, e.g., exam type, body area, scanner, etc. The data are refreshed daily to provide up-to-date information.
How to Access
 | Log into the NRDR Portal. In the left menu select CT Facility Comparisons. |
How-to Videos

View the 15:25 minute video to learn about navigating the report and its features.

View the 8:55 minute video to learn about using the Tableau Super Tables tool to create a report for downloading.
Report Help Features
The report is divided into four tabs called dashboards located across the top of the report. The About this Report dashboard provides a brief description of each dashboard, information about the measures and inclusion criteria, and a few pointers for navigating across the dashboards.

In each dashboard, hover the cursor over the information icon (blue circle) in the upper left corner to view a brief description of the dashboard's purpose and how to populate it with data.
Once the report is populated with data, click the Help link to bring up an overlay with specific report navigation instructions. Clicking the Read about this report link opens this Knowledge Base article and the Feedback link opens a user input form.
Dashboard Features
Facility Comparisons Report
This report shows the Corporate Account and affiliated Facilities dose indices' median performance for each dose measure compared to registry quartiles. To generate the report, select a corporate account from the menu. By default, the report shows data for each facility within the selected corporate account for the most recent quarter available.
The report has several filters that support a variety of views, e.g., by measure type, exam name, age group, etc. The filter selections in the gray box are shared across all dashboards. The symbol size in the scatterplot graph denotes the relative exam volume. The color-coding shows a facility's median exam performance for the selected dose index in comparison with the registry (or another selected peer group) that falls into one of four color-coded categories:
Below 25th percentile: Indicates the facility’s median performance value falls below the 25th percentile for the registry for the selected measure; that is, the facility’s dose levels are generally lower than the entire registry. This can be good provided the lower radiation doses are not at the expense of image and diagnostic quality.
Below the 25th and 75th percentile: The facility median was between the registry's 25th and 75th percentiles, about on par with the registry.
Between the 75th and 95th percentile: The facility median was above the registry 75th percentile which could indicate a need to investigate the higher value results.
Above the 95th percentile: The facility median was above the registry 95th percentile which likely indicates a need to investigate the high-dose results.

The above example shows results for a Corporate Account with multiple Facilities each represented by a different symbol in the scatter plot graph with the symbol size indicating the relative volume of abdominal exams. CTDIvol Max across Scans is the dose index selected for all exams performed in the last quarter of 2023 compared to 2022 results for the entire registry, all age groups, and all comparison standing categories.
Note: The Exam Limit and Display >= filters in the upper right corner enable limiting results to the top ten Facility/Exam Name/Age combinations or to set the lower limit of exams to be viewed. Check out the Custom Views video to see how to set up and save report settings.
Drill-down Capability
Hovering the cursor over a symbol in the scatter plot displays a pop-up box with exam details as shown in the below screenshot. Click a facility symbol to display a table showing the RPID and device details.


Click a row in the table shown above to display a box plot showing the full distribution of exams by protocol name and a scatter plot showing the distribution by study date.
Select an exam circle in the graph shown above to display a table of irradiation events.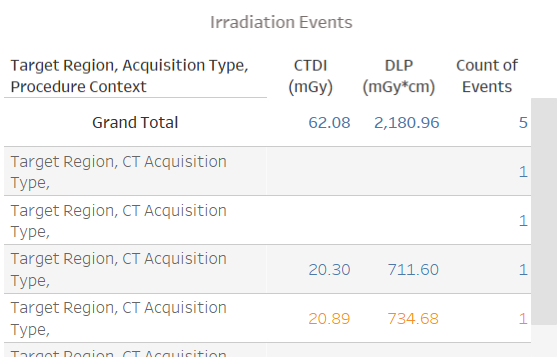
Data Download
This dashboard enables users to compare the performance of one or more facilities to the registry and one other peer group. The dashboard's format is designed for users to create a report for download with performance details of interest. The filters and functionality enable users to select which data to include and the order in which data are displayed.
Note: Select a Corporate Account to populate the report. To view a table with exam-level details set the Show Exams filter to Yes. Select the Help link in the upper left corner to view directions for downloading the report along with more filtering tips.

Short Name Lookups
The Short Name Lookup dashboard shows how a facility's studies map to RPIDs and the Exam Short Name. The list of RPIDs used to compute comparison statistics for that Exam Short Name is displayed.
To support robust dose measure comparisons, RPIDs are aggregated to a standardized Exam Short Name that combines sufficiently similar RPIDs.
The dashboard also highlights differences in mapping across Facilities within the same Corporate Account.

 | Previous: Executive Summary and QCDR Preview | Next: Corporate Excel Report |  |