Purpose
The DIR Leapfrog Report helps Facilities participating in the Leapfrog Hospital Survey complete their survey.
Report Help Features
The report is divided into four tabs called dashboards located across the top of the report. The About this Report dashboard provides a brief description of each dashboard, information about the measures and inclusion criteria, and a few pointers for navigating across the dashboards.

In each dashboard, hover the cursor over the information icon (blue circle) in the upper left corner to view a brief description of the dashboard's purpose and how to populate it with data.
Once the report is populated with data, click the Help link to bring up an overlay with specific report navigation instructions. Clicking the Read about this report link opens this Knowledge Base article and the Feedback link opens a user input form.
How to Access the Report
Log into the NRDR Portal .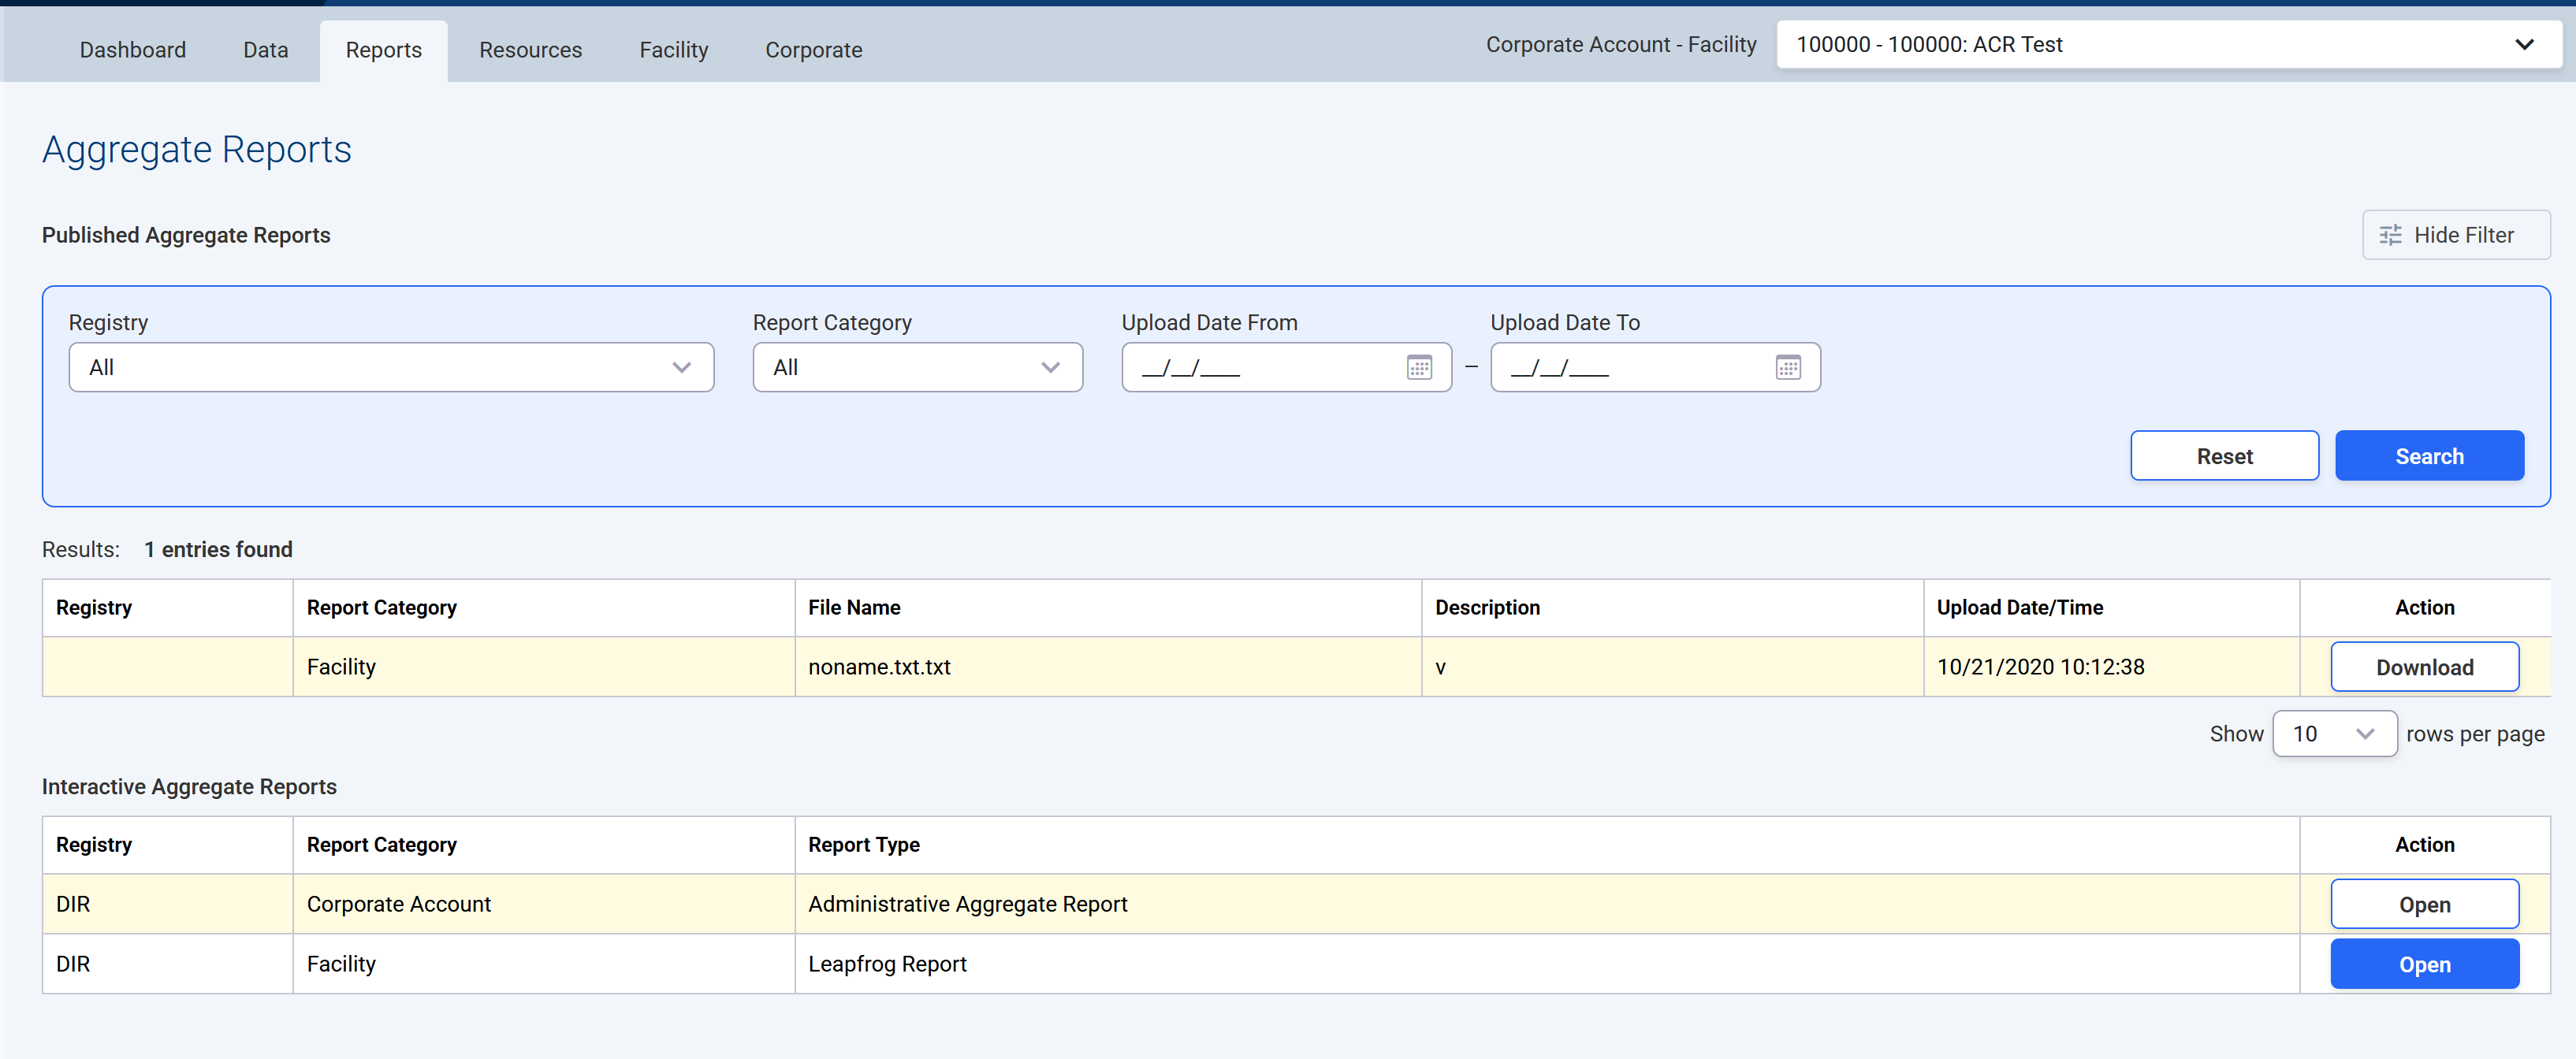
From the Reports menu, find the Interactive Aggregate Reports section, and select OPEN in the row with the Leapfrog Report.
How-to Video

View the video to learn about navigating the report and its features. Produced in January 2024
Dashboard Features
Leapfrog Dashboard
The Leapfrog dashboard is formatted for printing to provide input for data entry into the Leapfrog Pediatric CT Survey. Populate the report by selecting a Corporate Account and one or more facilities. The filters in the shaded grey box are shared across all dashboards. The From-To date filter defaults to the most recent Leapfrog reporting period.
As shown in the example below, the report displays the 25th, 50th, and 75th percentiles of Dose Length Product (DLP) for routine head and routine abdomen/pelvis CTs. It also can be filtered by Body Area, Scanner, Age Group, and RPID List. Encounters for anatomical area and age group combinations with fewer than 10 encounters for the reporting period are shown in red.
Select Show for the RPID List filter to display an Exam Counts by Eligible RPIDs table with the standardized RadLex Playbook IDs mapped to each body area included in the report and to view how many exams were used in the report for the selected facilities and period.

Note: Only body areas and age groups with data are included in the report; if there are no exams for a body part or an age group, that group is not included in the report.

Users with exam-level data access can download data from the Leapfrog Exams dashboard.
Drilldown Examples
The two screenshots below show examples of how to explore the data further using the interactive table filters.

Leapfrog Exams Dashboard
This dashboard displays all the exams corresponding to the filter selections. It helps identify and explore outlier exams and enables removing exams from the exam listing. The screenshot below shows an example of how to use the # Irridation Events filter to display only exams with 4 or more irradiation events.

Note: Click the Remove from all Dashboards link to remove an exam from the results.

 | Previous: Facility Excel Report | Next: Exam Detail |  |